*Aquare
Open Data for aquatic habitats
the problem
Only 8% of the German freshwaters are in a good ecological shape. Reasons for this problem are diverse. Pollution, straightening, as well as immigration of non-native species, are among the main reasons. The immigration of non-native species can cause whole ecosystems to collapse like a card house.
(As seen with Asian carps in the Mississipi)
There is an additional problem with these species: In aquatic habitats, they hardly will ever be discovered early enough, to stop the outspread, and data for research is also not available.
How to fight an enemy, without even seeing him?
our approach
Our project named „Aquare“, makes it possible, to have an eye on underwater happenings.
With the help of citizens science, and open data, we are able to generate the missing qualitative data for the research, on the topic of non-native species, as well as on the prevention of their outspread.
The most difficult step - data gathering for aquatic species research - is simplified drastically.
My parts included: Research, Concept, UX/UI Application, aswell as Prototyping for the Video.
*Research
kick-off
For the project kick-off, we started with a deep dive into the topic: ecological health of waters.
After we had the feeling, that wie gathered enough knowledge in topics like renaturation, the maintenance, as well as stressors of the ecological health, we came to the conclusion, that far too little is know about non-native species.
what defines a non-native species
A species that that is living outside of its natural habitat, is called non-native species. With increasing international trade, and the globalization in general, the immigration of these species rises. As already mentioned, state of knowledge is far too low: Only 3% of presumed 10% in Germany, are identified.
why are they a problem?
The following dangers result from non-native species:
In the most cases, the foundation of research is missing: Data. With this data, it is possible, to define reasons, consequences, as well as developing prognosis, to ultimately prevent ongoing spread of those species. What is known for sure, is the deep, and long-lasting impact on the ecosystem in the destination, as well as on humans, and the areas of medicine and economy.
For the project kick-off, we started with a deep dive into the topic: ecological health of waters.
After we had the feeling, that wie gathered enough knowledge in topics like renaturation, the maintenance, as well as stressors of the ecological health, we came to the conclusion, that far too little is know about non-native species.
what defines a non-native species
A species that that is living outside of its natural habitat, is called non-native species. With increasing international trade, and the globalization in general, the immigration of these species rises. As already mentioned, state of knowledge is far too low: Only 3% of presumed 10% in Germany, are identified.
why are they a problem?
The following dangers result from non-native species:
- Carrier of illnesses
- Unknown long-term damage for the ecosystem
- Decrease of the biodiversity
- Withdraw the livelihoods of native species
- Impossible to stop, once they are entrenched
In the most cases, the foundation of research is missing: Data. With this data, it is possible, to define reasons, consequences, as well as developing prognosis, to ultimately prevent ongoing spread of those species. What is known for sure, is the deep, and long-lasting impact on the ecosystem in the destination, as well as on humans, and the areas of medicine and economy.
in Germany: Lepomis Gibbousus
*Interviews
ask specialists
In this step, we started off with collecting questions for different specialists in the field of aquatic habitats. To see every perspective was a goal of the interviews, that’s why we had interviews with fishermen, water-biologists, non-native species researchers, environmentalists, district administration (department of surface water), and the regional office for environment.
In this step, we started off with collecting questions for different specialists in the field of aquatic habitats. To see every perspective was a goal of the interviews, that’s why we had interviews with fishermen, water-biologists, non-native species researchers, environmentalists, district administration (department of surface water), and the regional office for environment.
key-Insights
*Fishermen serve a major spot in the population recording
*Immigration of non-native species rises with ongoing globalization
*Authorities are missing a system to monitor / report non-native species
*Data collection is a problem, there is a massive lack of qualitative data for aquatic habitats
*There are a lot of requests by fishing clubs, how to handle non-native species
*Concept
the core
The core of the project lays within the reports of species that live in aquatic habitats, with an extra eye on the non-native species. The generated data is then available to download for researches, without any costs, on our website. To generate current data as extensive as possible, we are reliant on the assistance of our users. There is even a special term for that:
- citizens science -
Basic citizens come together, in order to generate data for research. This gathering is called „Citizens science“.
To sum up, citizens science is a positive thing. There are already some projects out there, which focus on documenting populations of animals. But there is also a strong point of critique to it: A lot of time, those citizens-science projects struggle with the quality of the data. Why is that?
Most of the people that are participating in these projects, can’t prove any expertise in the department of nature. Because of this fact, we had to make a good decision about who is going to be the user / target group of our project.

Concept

Who is our user group?
We examined all the different communities, that regularly spent time at the waters. Out of these communities, we decided that our target group, is going to be the Fishermans, for the following reasons:
How about the willingness of fishermen to send reports?
To make sure, our target group would also report the non-native species, that are not directly in their interest, we did a survey in a fishing forum.
Out of 320 participants, 307 of the asked fishermen were willing to report the non-native species. They claimed, that a lot of times, they can already feel the backlash of those non-native species, depending on the area they live in. Only 13 fishermen showed no willingness to do so.
To guarantee a great Userexperience, for those who are using our application, we decided to provide a digital catchbook. This catchbook allows the user to fill in all relevant informations. Its way more detailed, than the analog paper-catchbook.
We examined all the different communities, that regularly spent time at the waters. Out of these communities, we decided that our target group, is going to be the Fishermans, for the following reasons:
- Fisherman have to acquire knowledge about waters practical, as well as theoretical, to pass the examination for the fishing license
- Also, with this license, fisherman are eligible to remove fish from lakes or rivers. That means: if a invasive species is found or catched, they are obligated to remove it
- The third point is, that fishermen are at these aquatic habitats on a regular, and they also collect data about the catch, or take pictures, without even asking for it
How about the willingness of fishermen to send reports?
To make sure, our target group would also report the non-native species, that are not directly in their interest, we did a survey in a fishing forum.
Out of 320 participants, 307 of the asked fishermen were willing to report the non-native species. They claimed, that a lot of times, they can already feel the backlash of those non-native species, depending on the area they live in. Only 13 fishermen showed no willingness to do so.
To guarantee a great Userexperience, for those who are using our application, we decided to provide a digital catchbook. This catchbook allows the user to fill in all relevant informations. Its way more detailed, than the analog paper-catchbook.
*How might we?
To carve our concept into stone, we decided to formulate a how might we:
“Aquare”
is a system for fishermen, institutions and authorities, to monitore native & non-native species in the aquatic habitats.
“Aquare”
is a system for fishermen, institutions and authorities, to monitore native & non-native species in the aquatic habitats.
It is more constant, more revealing, and quicker then a report per mail.
We achieve that trough a digital catchbook, that brings the fishermen to learn more out of their catch, and the connected report of
non-native species.
*Main functions
application
dekstop/webversion
The generated informations of the interviews, showed us, that the collected data is extremely important for the research in this topic. To improve the situation with the missing data, we decided to provide the collected data for free via a desktop version of our application.
This way, we can guarantee, that every researcher is now able to become acces to qualitative data, wich is to this day, very hard to get.
- Report of Catches / Sightings
- Image recognition: improves data quality
- Waiting list: After a catch, the fishermen has to handle the living species first, that’s why startet reports / taken images, can be worked out later
- Digital Catchbook, with all possible Information
- Invasiveness indication: into three groups, invasive, potential invasive, non-invasive
- Community: Users can show off what they found / catched
- Verification of the reports: Are the informations provided, correct?
- Index: Informations about all aquatic species
dekstop/webversion
The generated informations of the interviews, showed us, that the collected data is extremely important for the research in this topic. To improve the situation with the missing data, we decided to provide the collected data for free via a desktop version of our application.
This way, we can guarantee, that every researcher is now able to become acces to qualitative data, wich is to this day, very hard to get.
- Community: Users can show off what they found / catched
- Datacenter: configure the right dataset for your needs

Invasiveness indication in visual appearance
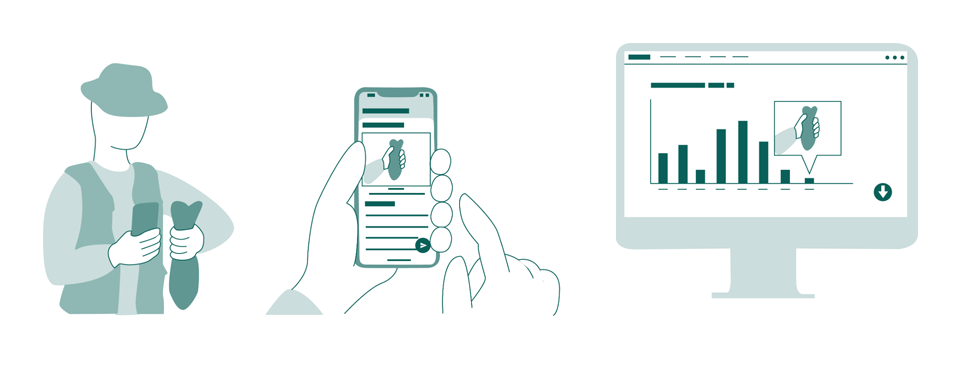
*Usecase
*Rapid prototyping & Usertest


Test instructions
procedure
Three quick prototypes were made: Each one contained the main functions of the application, the difference between them, was a different operating logic. Combined with a usertest of all three, we were able to know wich operating logic was the most intuitive one, and we were able to generate insights to eradicate weak spots. Due to the Covid-19 situation, the usertest had to done online. Important for us was to be able to test every function of the prototypes.
Thats why we decided to organize a remote usertest, at which the interactions with the prototype, as well as the facial expression of the test person was filmed. A advantage of the remote usertest: The user is in his natural surrounding, what results in a lower tension.
Our Testperson was a fisherman, 26 years old, and experienced in the handling of smartphones. We transmitted him the test instructions in advance.
userjourney
Afterwards, we created a user journey for every prototype, to determine the moments of irritation. Here you can find a example of the user journey I created.
The result: With this step we were able to find out which prototype was the most intuitive one, with feedback to improve. The fundament of the further process.

One of the three userjourneys
*Priority guides & Wireframes


Priorityguides

Low-fidelity wireframes
priority guide app / web
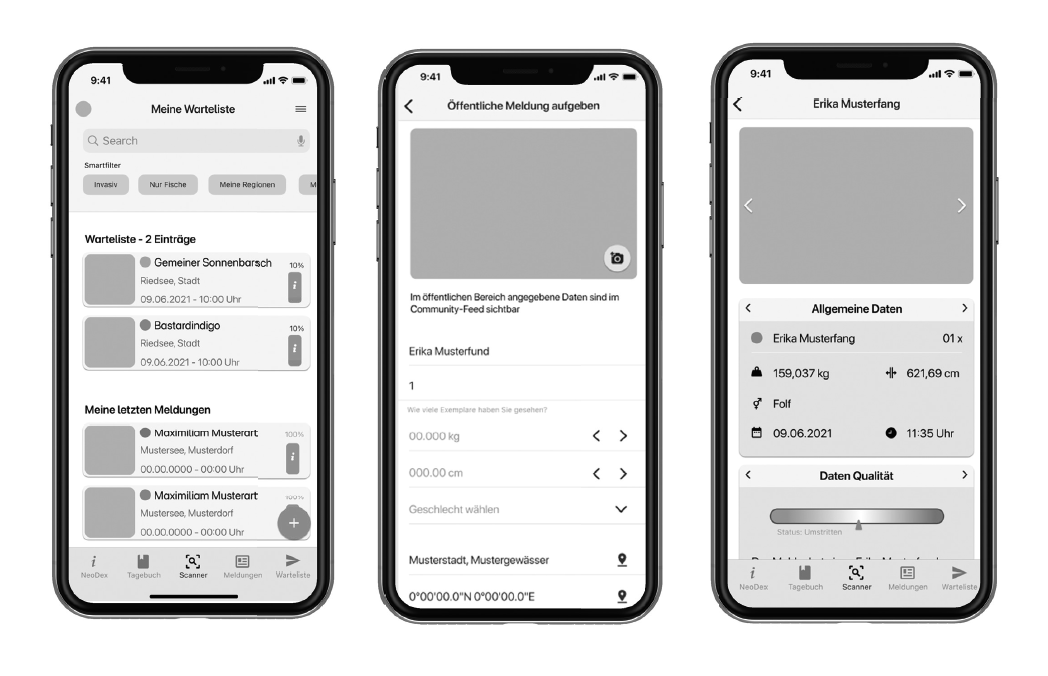
Trough the usertest we became aware of negative aspects in the structure of the application. So we started over with a priority guide for the final & complete build. We collected all functions, and arranged them with the usertest feedback in a priority guide.
Wireframes
For this we started off with designing the hero screens of the application. On these we were doing a lot of iterations, then discussed those, and kept optimizing the screens. After the hero screens were finished, we completed the remaining wireframes. It wont go into deepness here, because its a standart procedure.
A lot of iteration happened, in terms of the wireframes, and the styleguide. Same goes for the web version.
Becoming high-fidelity...
*Styleguide
primary-colors
Black #000000 is used for the higher-level elements, like headlines, and to show the user on what screen he is.
The dark green #096059 is used as primary interaction color. All elements marked in this color, are interactive. It is used in buttons as well as text.
With dark gray #3c3b48 we are labeling non-interactive, standard elements. It is used for text, as well as boxes.


secondary colors
Super Light green #E7EFEF is used as secondary interaction color. Buttons or text with low importance are marked with this color.
Loud green #27B179 is mainly used to rate things, it counterparts the red. Good quality of data is shown in this color, as well as ratings of lakes, or your favorite catches.
Light green #F3F5F4 finds usage in informative elements: Text fields with indication, or only indications.
Salomon #EFA991 is used to label the invasiveness of a species. It delivers a great contrast to the green, and fits aesthetically.
Red #CF3E3E is mainly used as warning color. Required fields that were not filled in by the user show off in this color. It gets also used to describe low-quality of provided data in a report.
Grey #7B7B7B is used for inactive elements.
nunito sans
„Nunito Sans“ is used as striking display typeface. It is used for headlines, in the application, as well as on the web version, to provide a consistent appearance. Out of all styles, only bold is used.
The calm and spacious character of „Nunito Sans“ is a perfect fit for the whole topic of fishing or being outdoors - a calming activity.

Nunito Sans

Lato
lato
„Lato“ is used as corporate typeface. This font is used for running texts, as well as indications. Following styles were used: regular (text), medium (indications), italic (further indications).
We chose „Lato“ because of its light, but compact character. It also provides a good readability. The combination of „Nunito Sans“ & „Lato“ brings a unique character to the whole project, and is also used for the documentation and logo.
logo and name
The logo is based on the Daoisms Yin & Yan symbolic. It shows off the correlation between humans and nature, especially trough the immigration of non-native species, and the following counteraction of humans to restore the natural conditions. For the abstraction we used our geo position symbols, as well as the symbols that label the invasiveness of a species.
„Aquare“ is a amalgamation of the words „aqua“ and „aware“.

*Final draft application

Scan
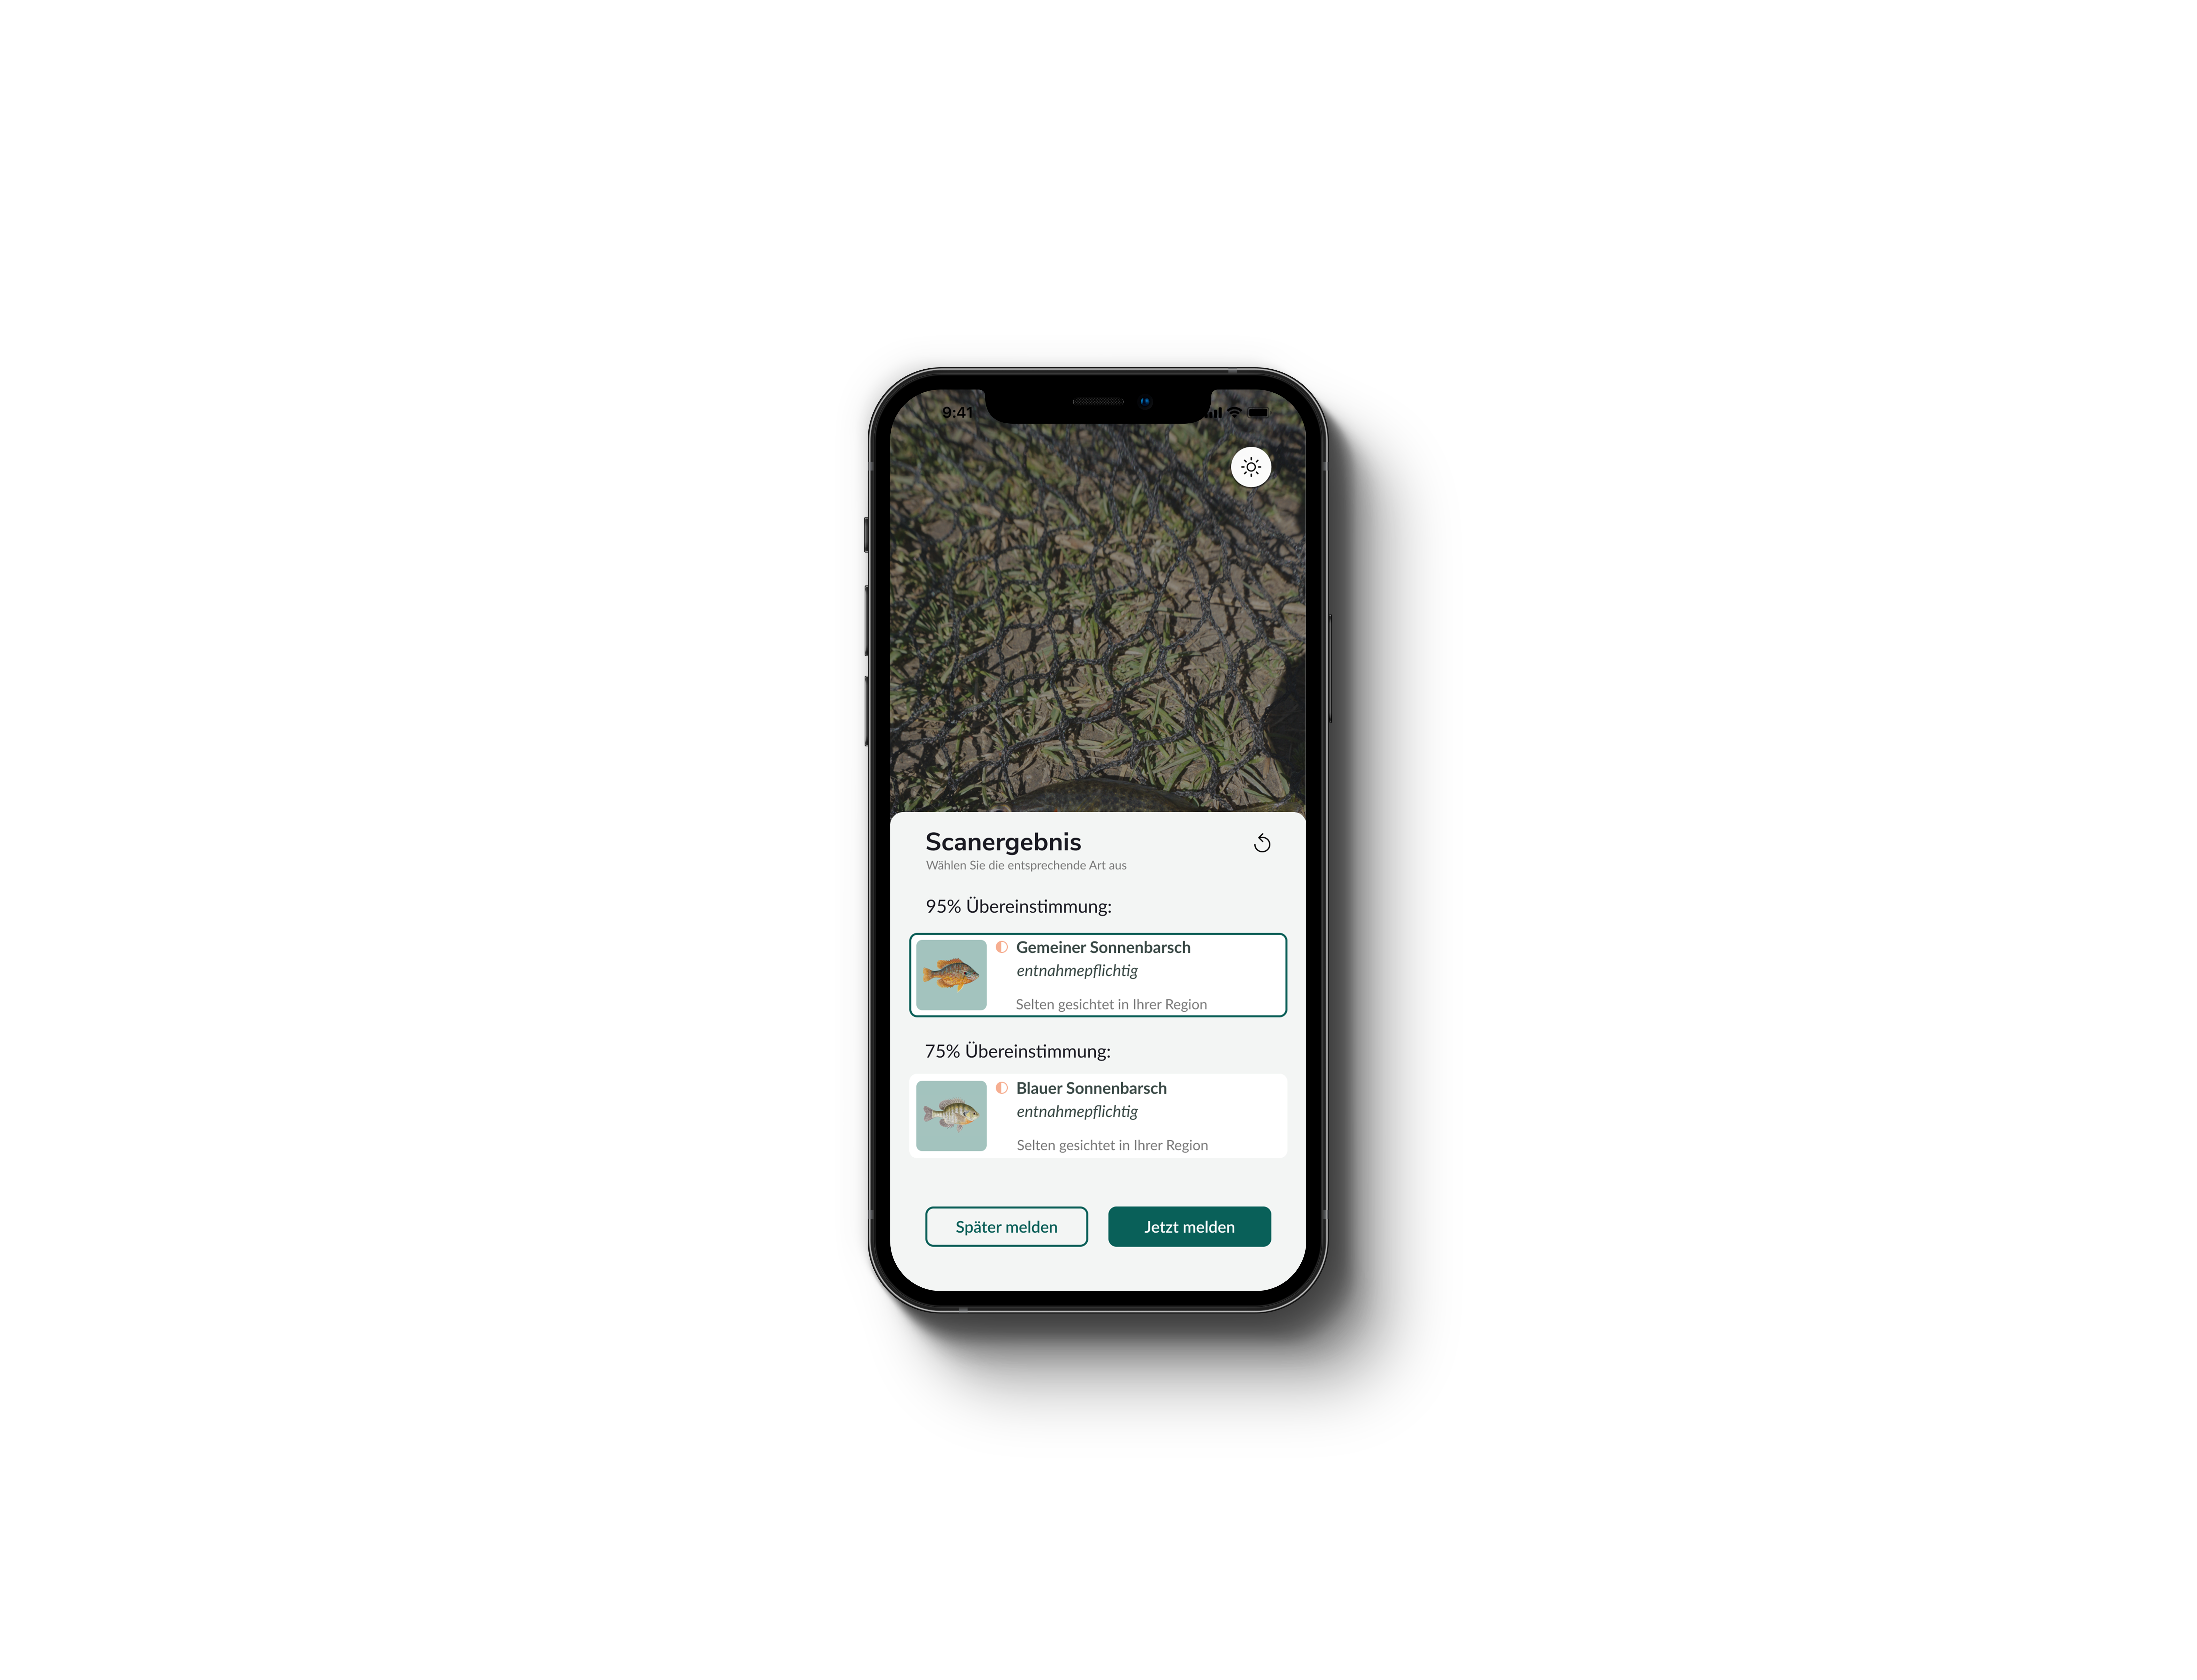
This is the starting point of the application. There is no splash screen, because Users need to document the species as quick as possible. In this screen, the user is able to scan the species with image recognition. Within the popup, similar species that could be possible, will be shown, as well as instructions for action.
Furthermore, its possible to choose if you want to send a report directly, or later after care of the species was taken.
report
If the user chooses to report directly, a list will pop up, in wich every information regarding the discovery can be filled in. Categories like the species, are auto-filled in, because of the image recognition (still editable). The process of filling in is also guided with a progress bar. After the successful report, the user receives a visual feedback through a radar animation, that shows the user if the same species has already been reported in this area. Within this feedback, he can also decides if he wants to add the discovery to his catchbook.


waiting List
In this area the user will find all scans, that he chose to report later. He can see the image of the scan, the name of the species, the location, as well as the time, the level of invasiveness, and how much information the report already has. This is very important, as fishermen are a lot of times in areas where the mobile connection isn’t that good, and they have to take care of the living animal directly after the catch. It is also possible to create a new report here, with no image (if enough other details are provided to verify), or add a image out of his camera roll.
catchbook
This is the third main area. In this private area its possible to fill in extra information like fishing technique, or meteorological details to already saved catches. These extra information will be private to the user, as fishermen tend to keep their secrets. It is also possible to create a entry without doing a report. Also compared to the waiting list, the tiles show different informations that are more important for the user group. The focus in this area is fishing. It is also possible to switch from the list, to a map view.
This is the third main area. In this private area its possible to fill in extra information like fishing technique, or meteorological details to already saved catches. These extra information will be private to the user, as fishermen tend to keep their secrets. It is also possible to create a entry without doing a report. Also compared to the waiting list, the tiles show different informations that are more important for the user group. The focus in this area is fishing. It is also possible to switch from the list, to a map view.




discover
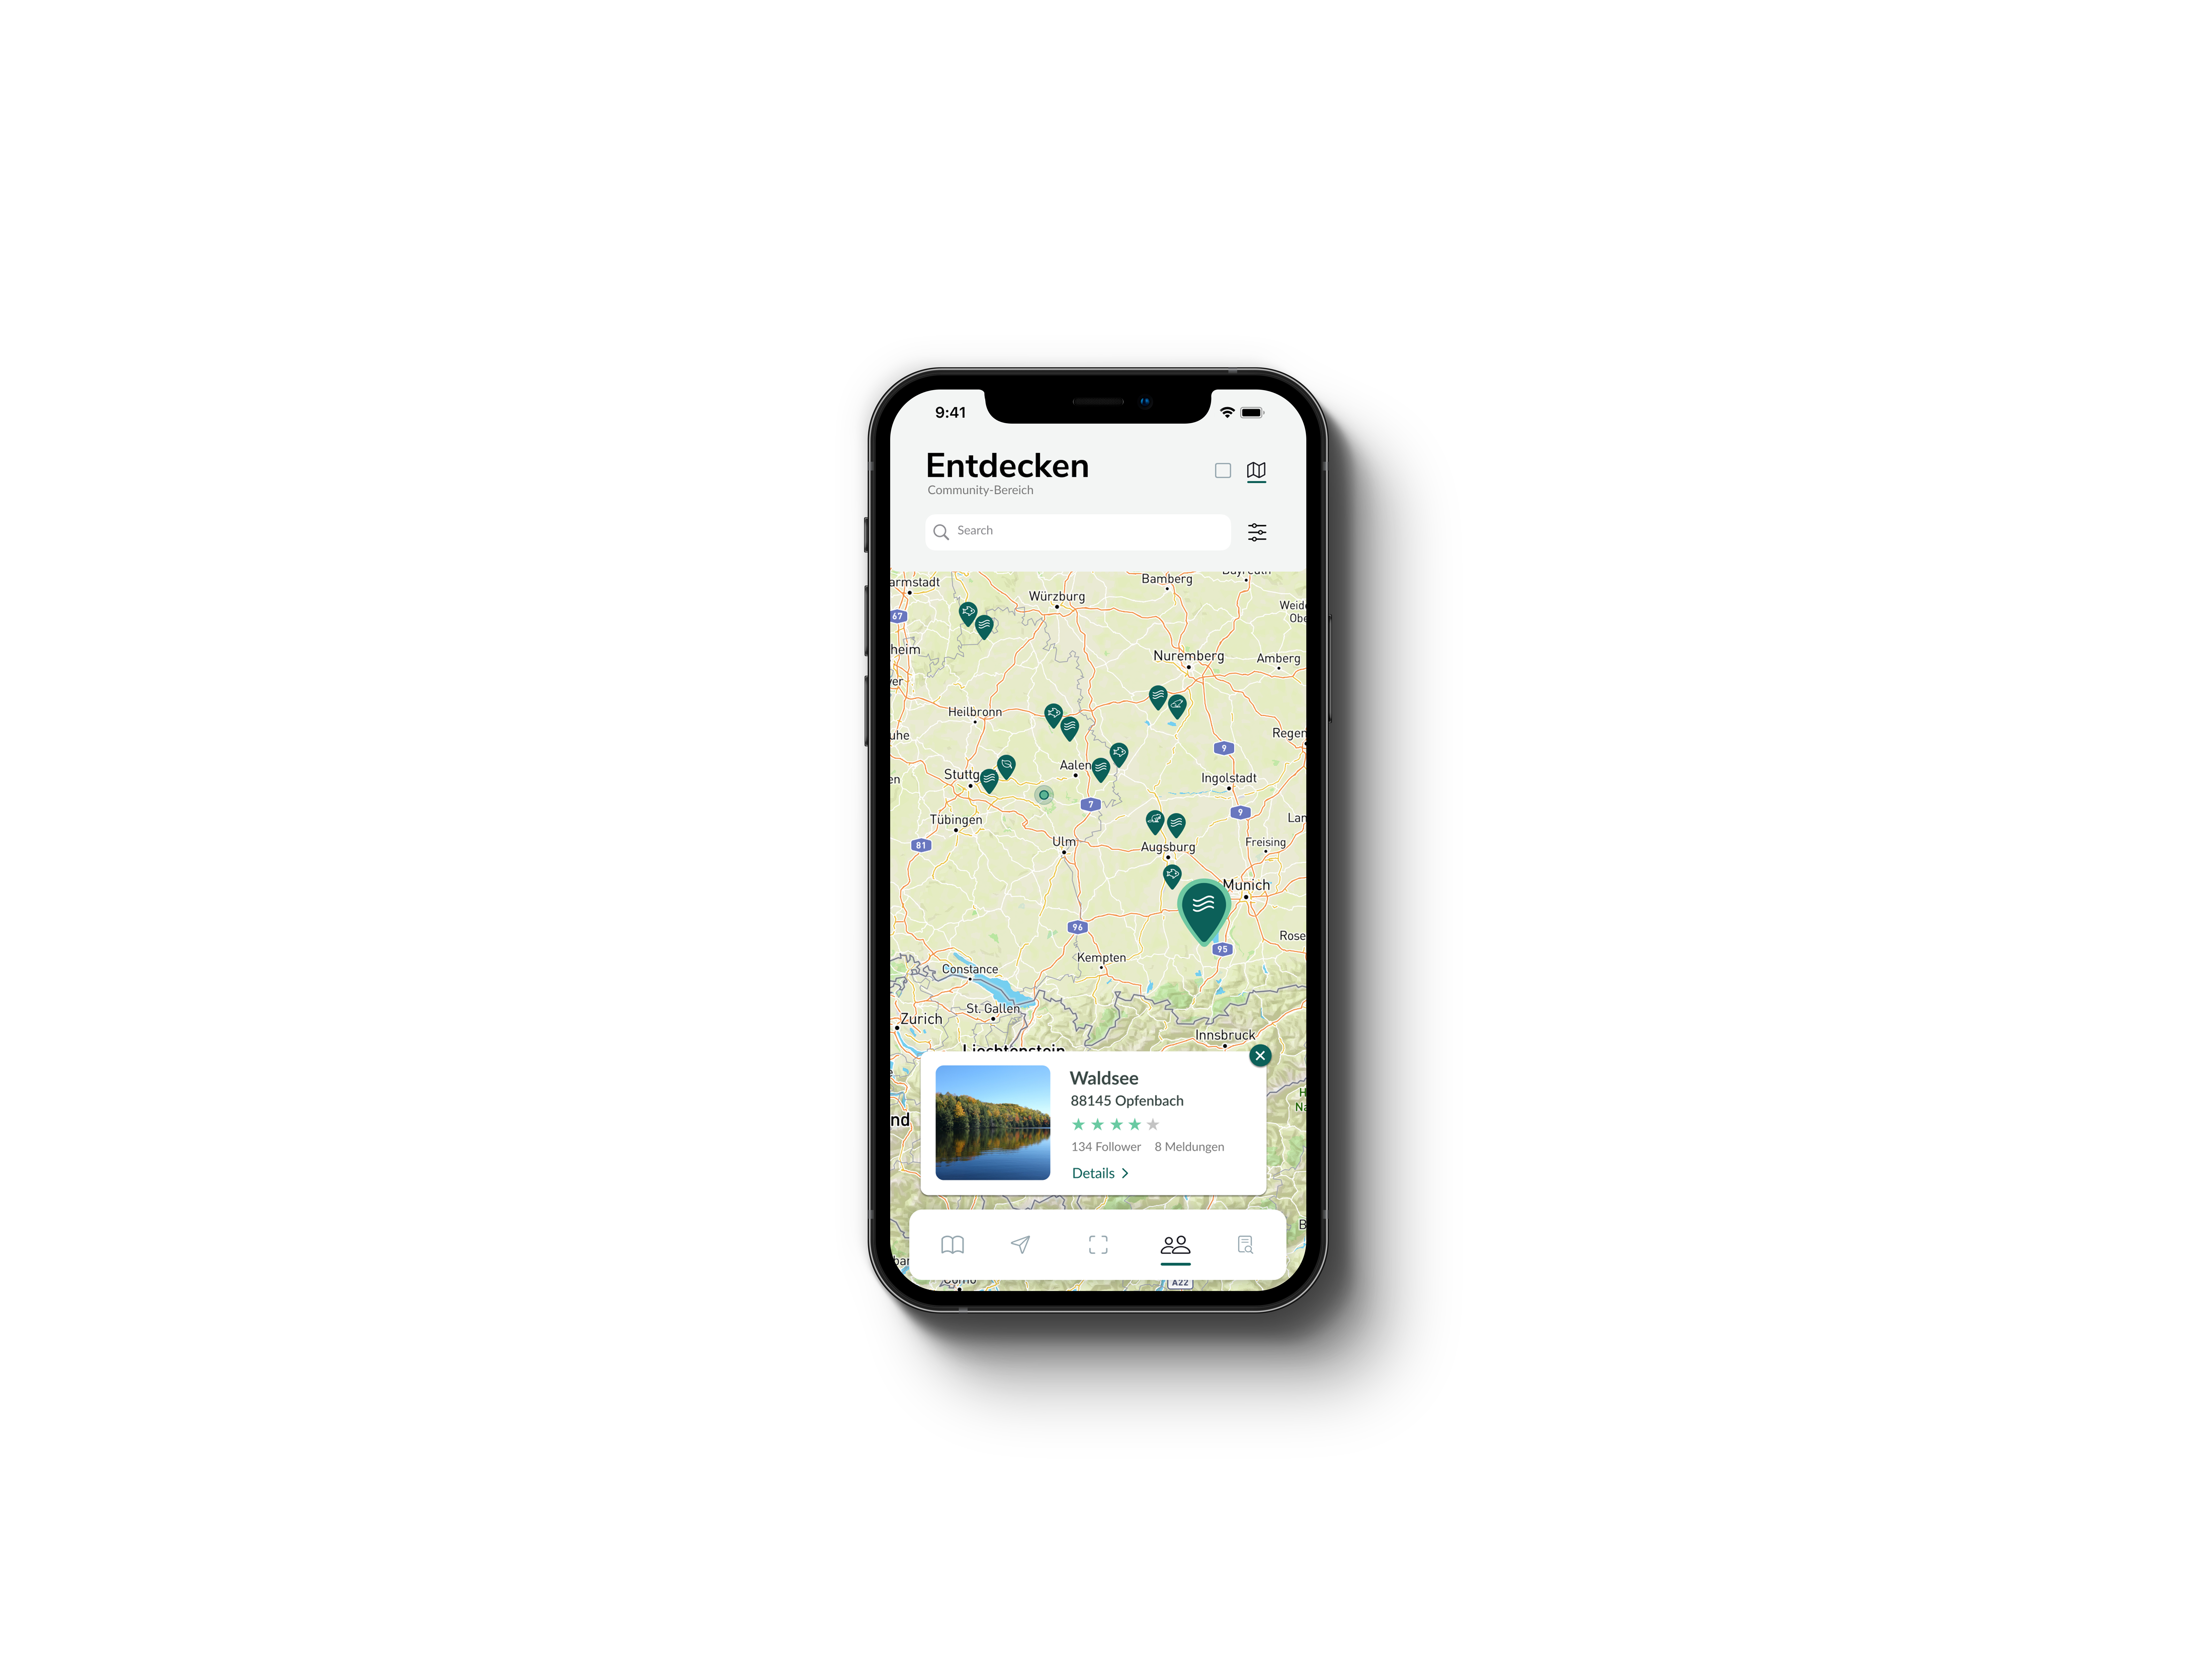
The community area of the application. All public reports can be found in here. As the goal of the application is to generate qualitative data, the focus in this area lays in the quality of data. Thats why the tiles show only goal relevant information like the area the catch was made, who catched, a picture of the species, the name of the species with the invasiveness indication, and how the quality status of the report is. The location of the discovery is in the primary interaction color, means that it is possible to gather further details about the aquatic habitat. Like in the other areas of the application, you can switch anytime to the map view, or filter the shown reports.
verification
If you want to verify a catch, to improve the data quality, or want to see more details to the catch, with a tap its possible to get to the detailed view of the catch. In here its possible to confirm the catch with the thumbs up button, or to deny the correctness of the provided information with a thumbs down.
If you want to verify a catch, to improve the data quality, or want to see more details to the catch, with a tap its possible to get to the detailed view of the catch. In here its possible to confirm the catch with the thumbs up button, or to deny the correctness of the provided information with a thumbs down.


profiles
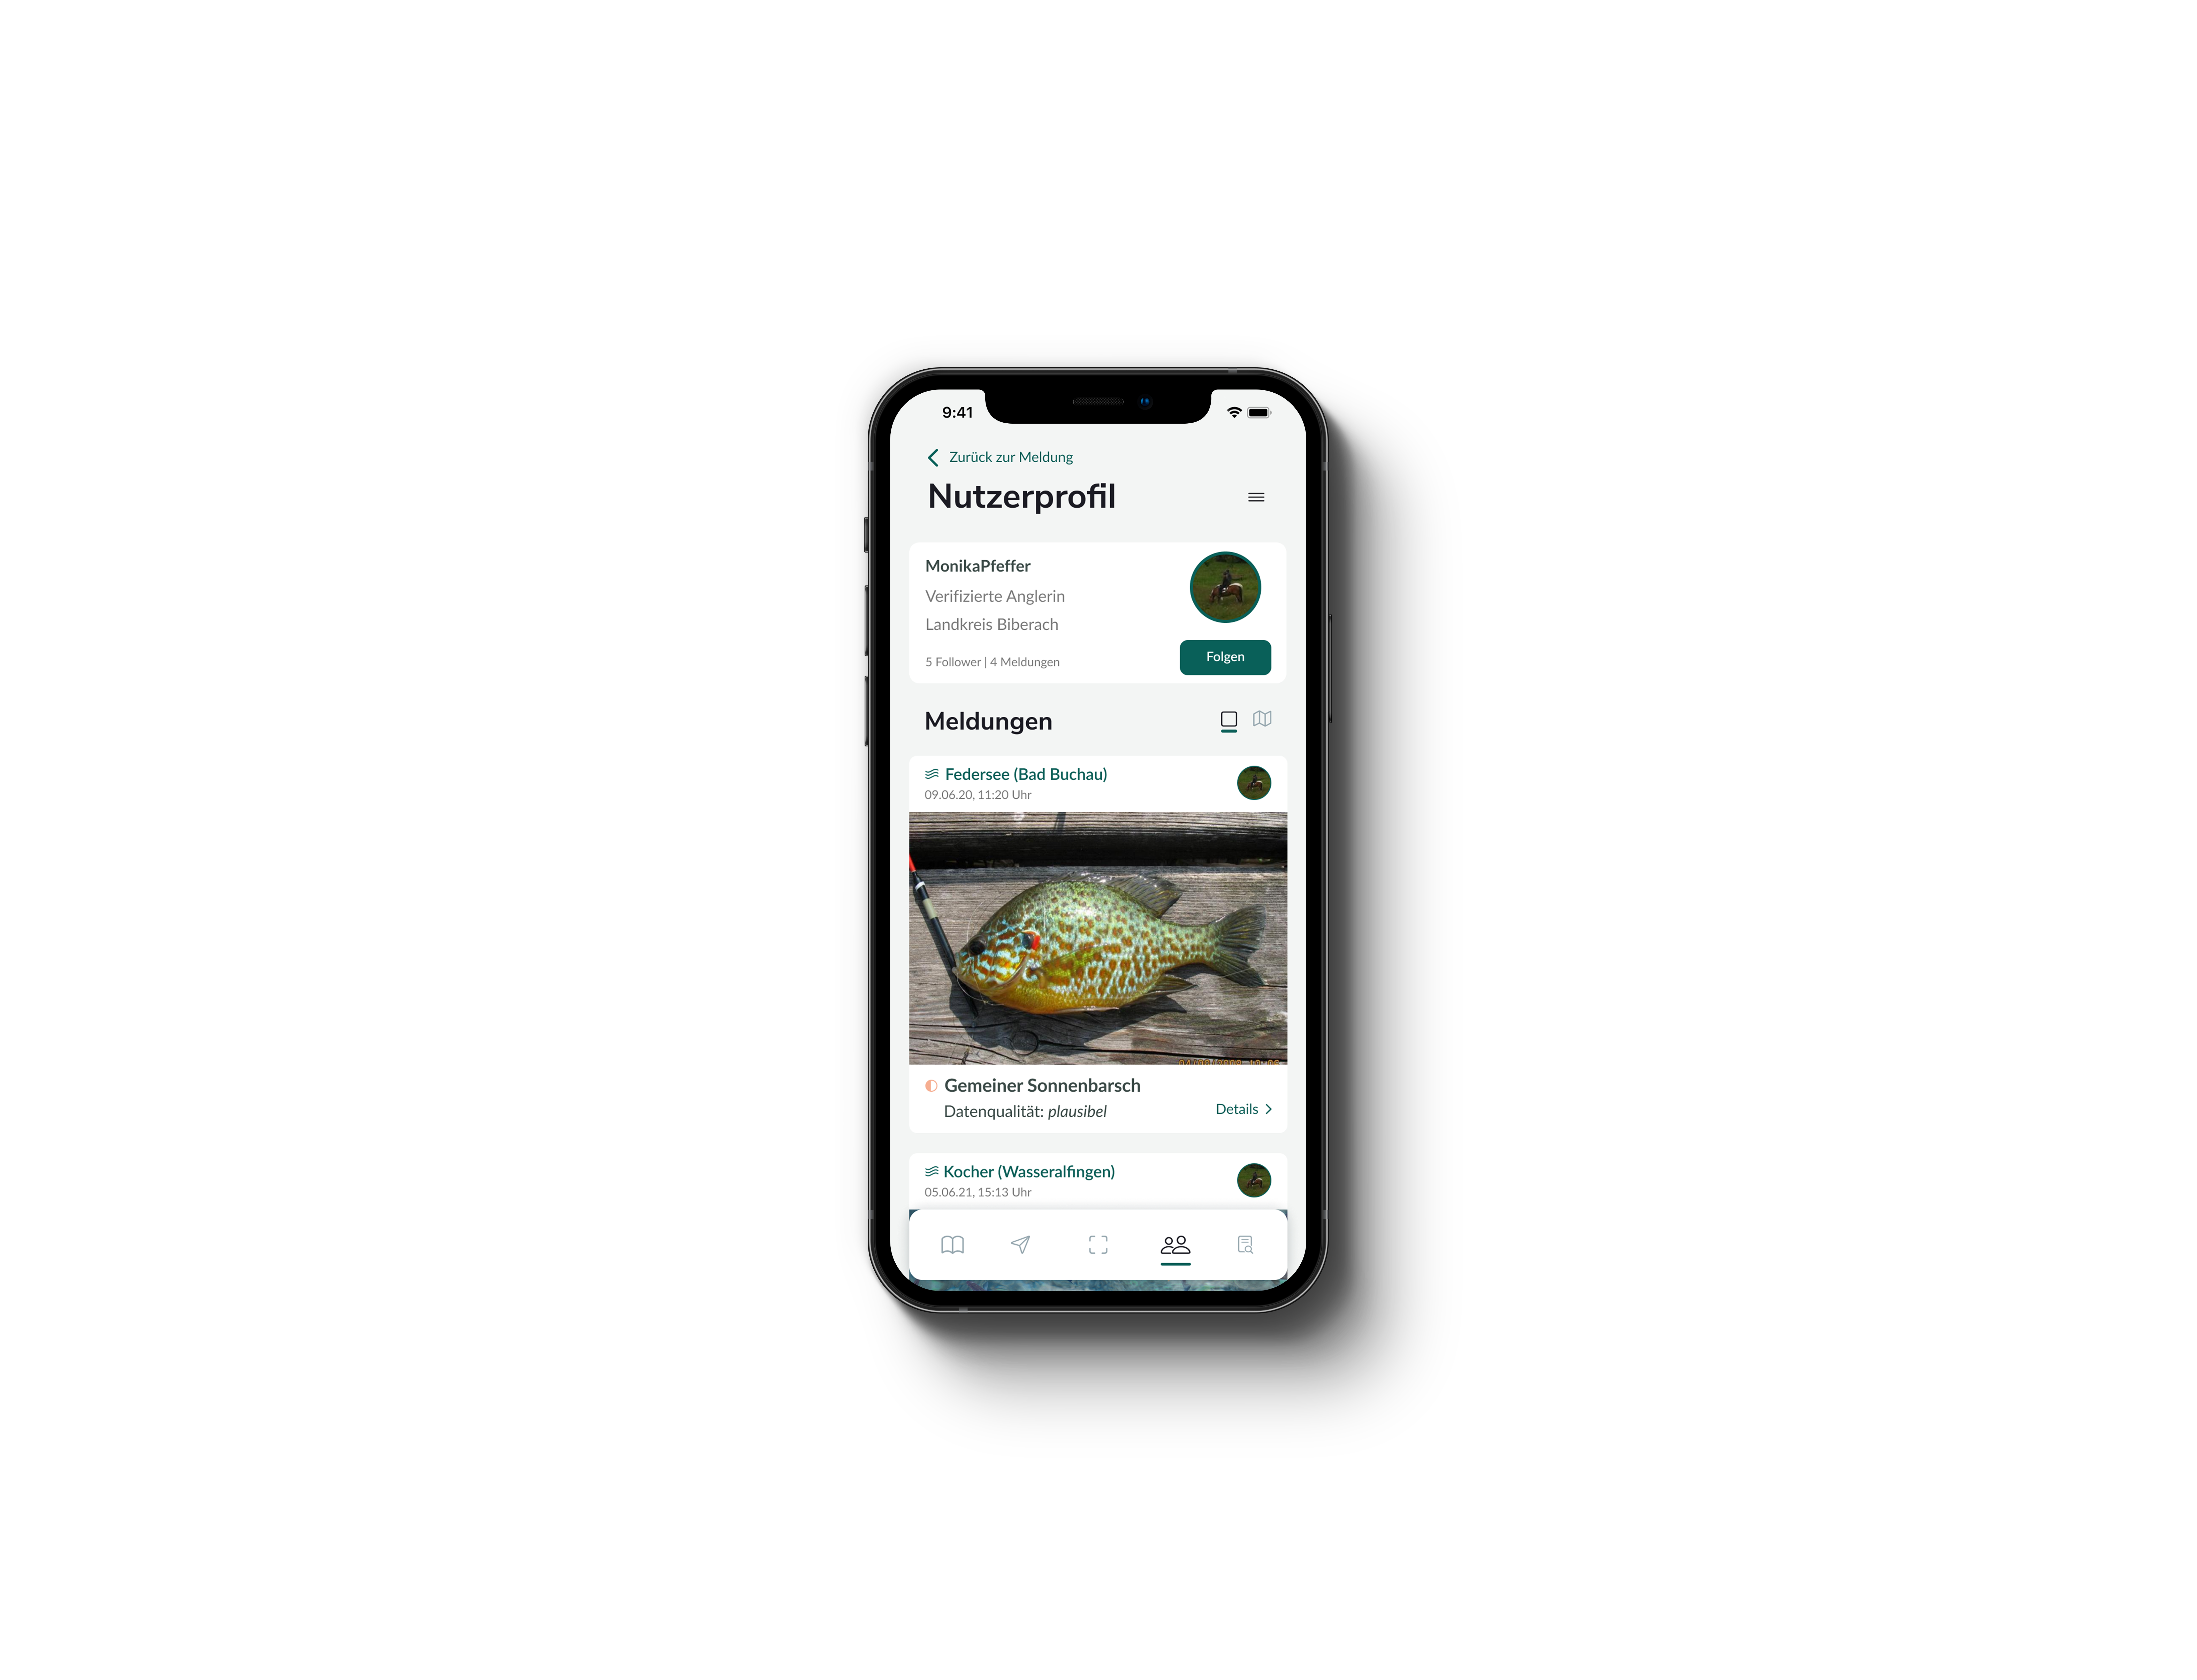
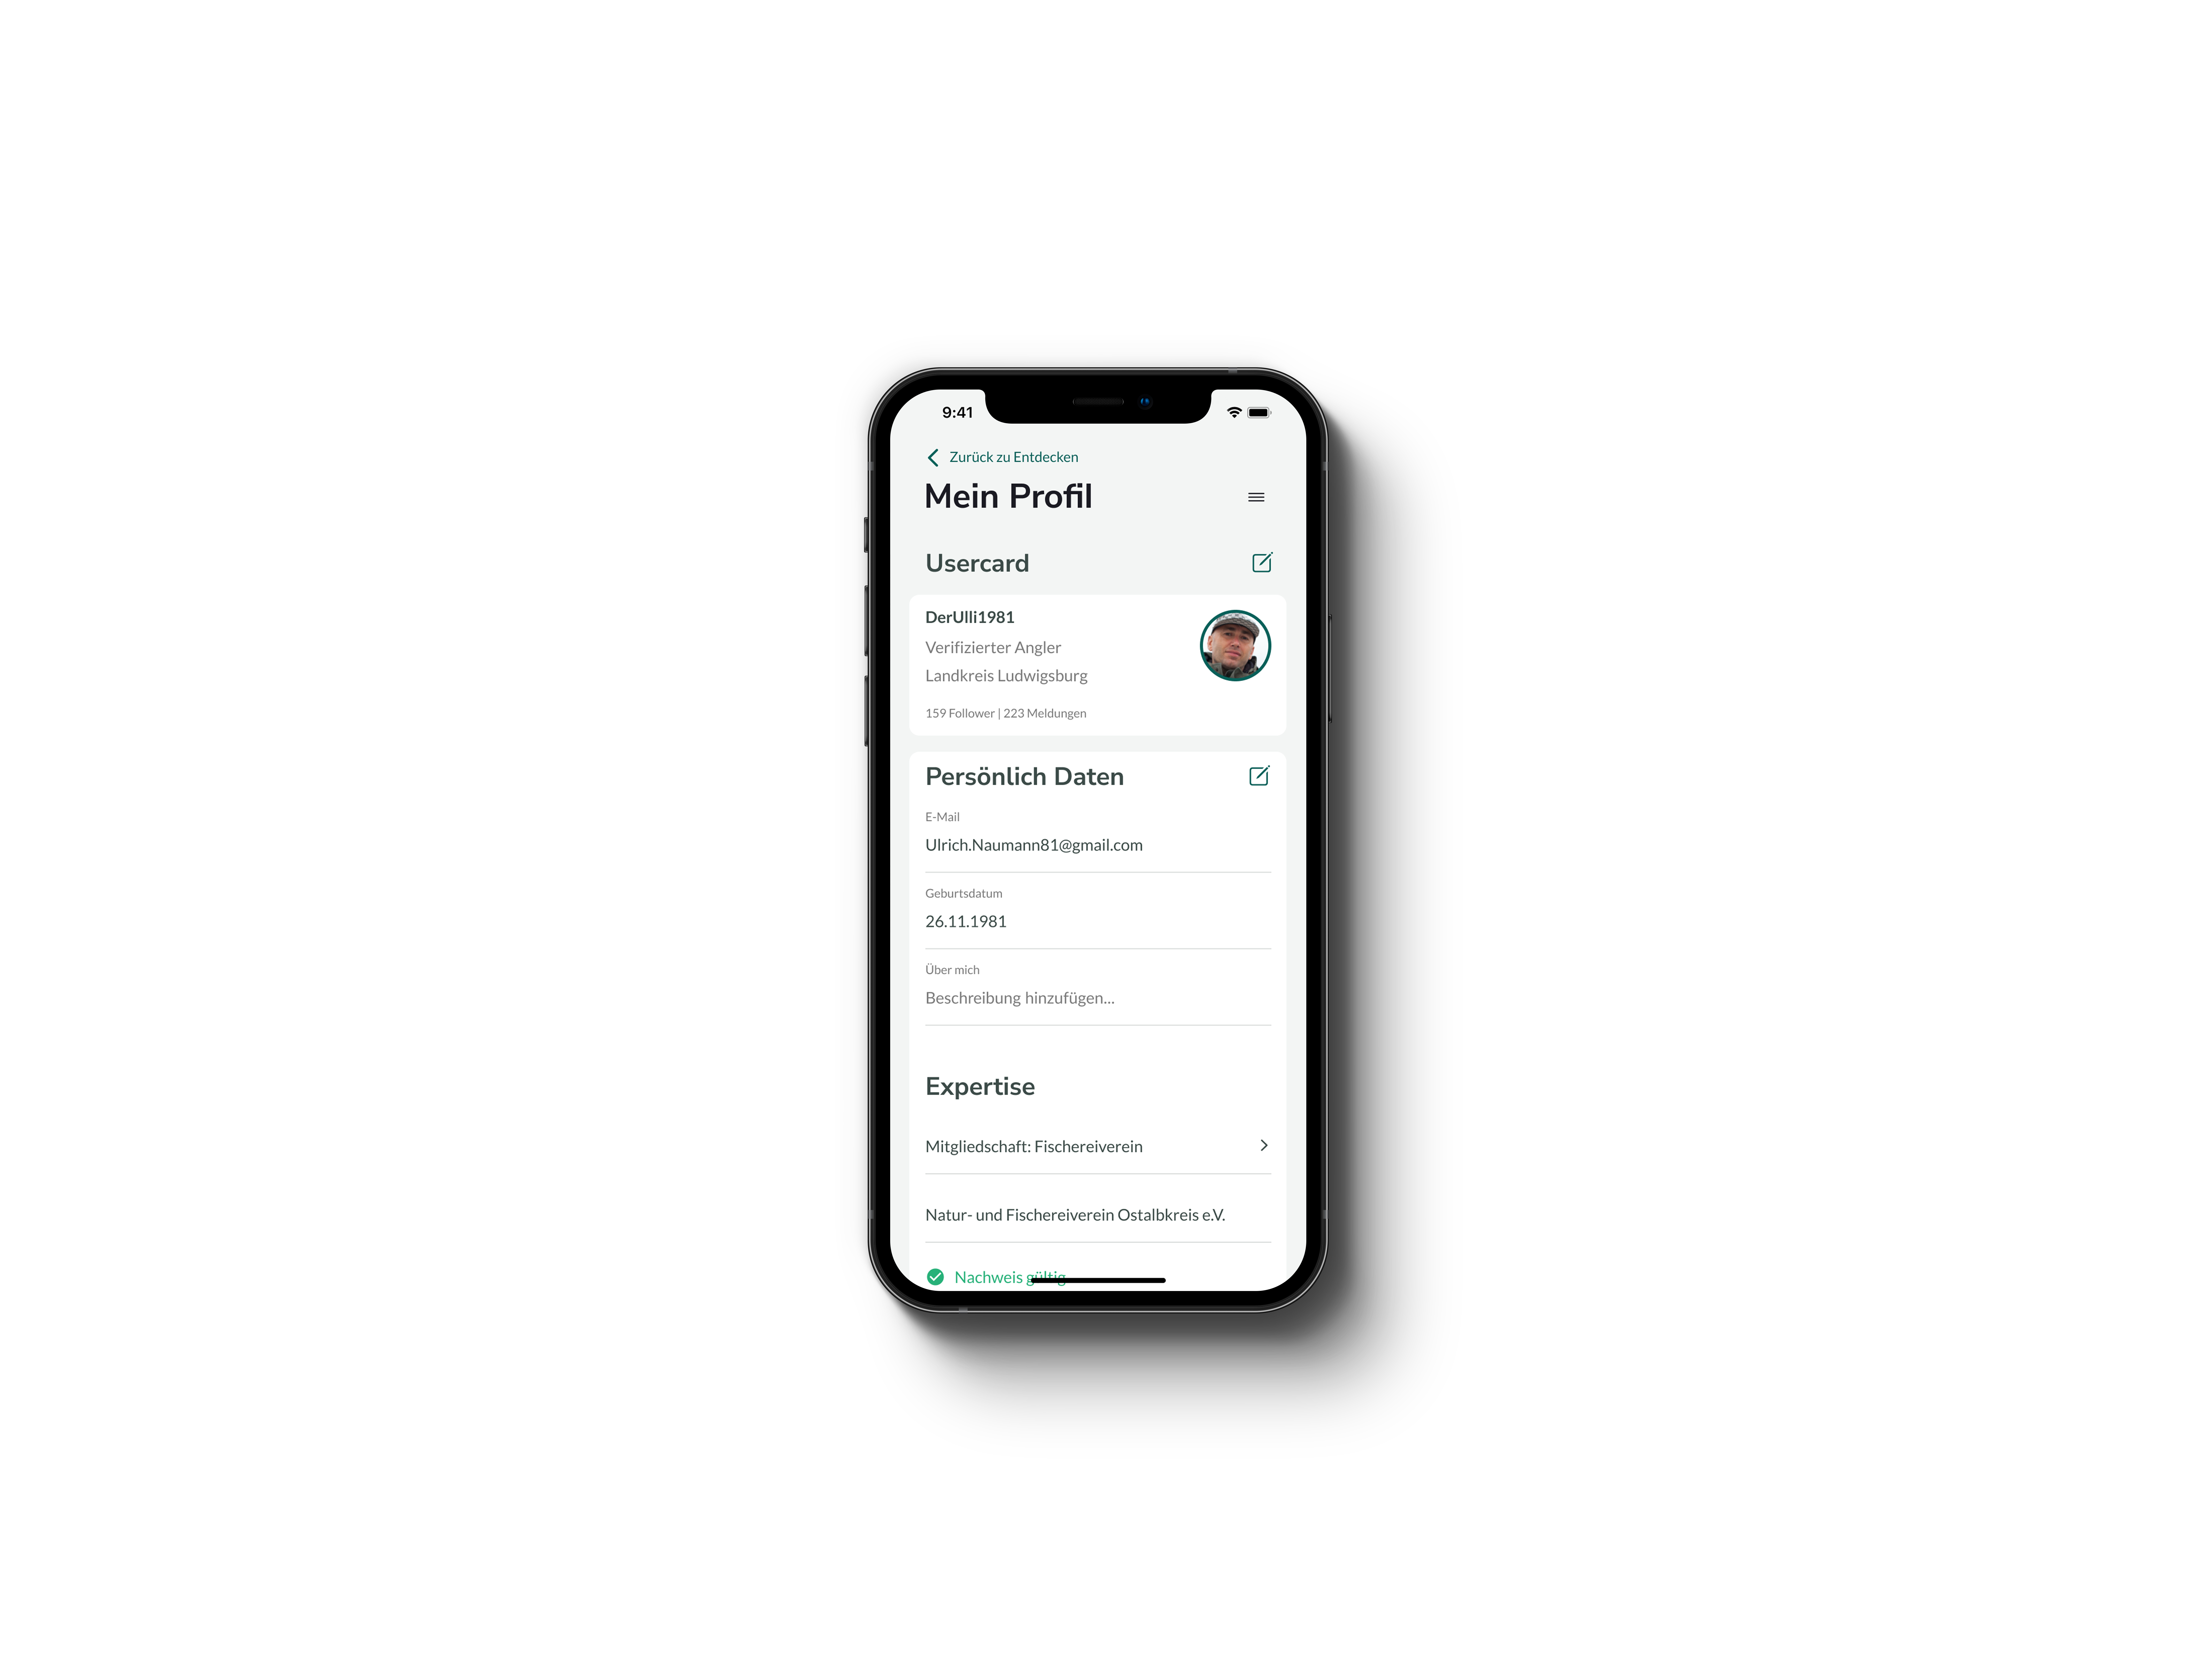
If you tap on the green embedded profilimage on the tile, you can see what qualifications the reporter has, and what discoveries were made by this user. This provides more of a community feeling. It is also welcomed to verify your expertise in your own profile, like participating in a fishing association, or your fishing license.
If you tap on the green embedded profilimage on the tile, you can see what qualifications the reporter has, and what discoveries were made by this user. This provides more of a community feeling. It is also welcomed to verify your expertise in your own profile, like participating in a fishing association, or your fishing license.
index
Fourth main area - A immigration of a new species can happen overnight. To stay up to date, users can find all species of aquatic habitats in this area. Already seen species are marked with a eye-icon in the top right corner of the tile. In the detailed view further Informations can be found, like characteristics, the natural environment and so on.
Fourth main area - A immigration of a new species can happen overnight. To stay up to date, users can find all species of aquatic habitats in this area. Already seen species are marked with a eye-icon in the top right corner of the tile. In the detailed view further Informations can be found, like characteristics, the natural environment and so on.


*Final draft web
discover
As already mentioned in the application part, users can see found species on the map, and read further details .
As already mentioned in the application part, users can see found species on the map, and read further details .


data-center
To prevent irritation, we decided to not provide a graph for the data. This area is designated to the download of datasets. These datasets can be filtered on the Website. It is possible to filter:
- Species: all, non-native species, native species, individual species
- Invasiveness: all, invasive, potentially invasive, non-invasive
- Date: all, this month, last month, or individually prefered
- Location: all (whole country), individual area
*Info
Bachelorthesis SoSe 2021
Project has been accompanied by:
Prof. Michael Schuster
Prof. Hartmut Bohnacker
Project has been accompanied by:
Prof. Michael Schuster
Prof. Hartmut Bohnacker
Team consisted of:
Robin Bork
Luis Eberhardt
Patrick Straub
Robin Bork
Luis Eberhardt
Patrick Straub
Robin David Bork
© 2024